

 Follow

Virginia Pham | Special Contributor to Off the Block
Have you ever wondered what you can extrapolate from box scores but never had the time to do it yourself? Well, here’s some information pulled from all 205 box scores for all seven tournament teams from this 2023 season.
This is a simplistic overview of points scored and errors made. While the box score can’t show you the whole story of how points were score (i.e., what attack combinations worked, how passing was affected through the match, etc), sometimes the box score can give you a decent story of what happened. Of course, there are always some weird five-game matches where statistical anomalies occur, but that’s an analysis for another day this summer.
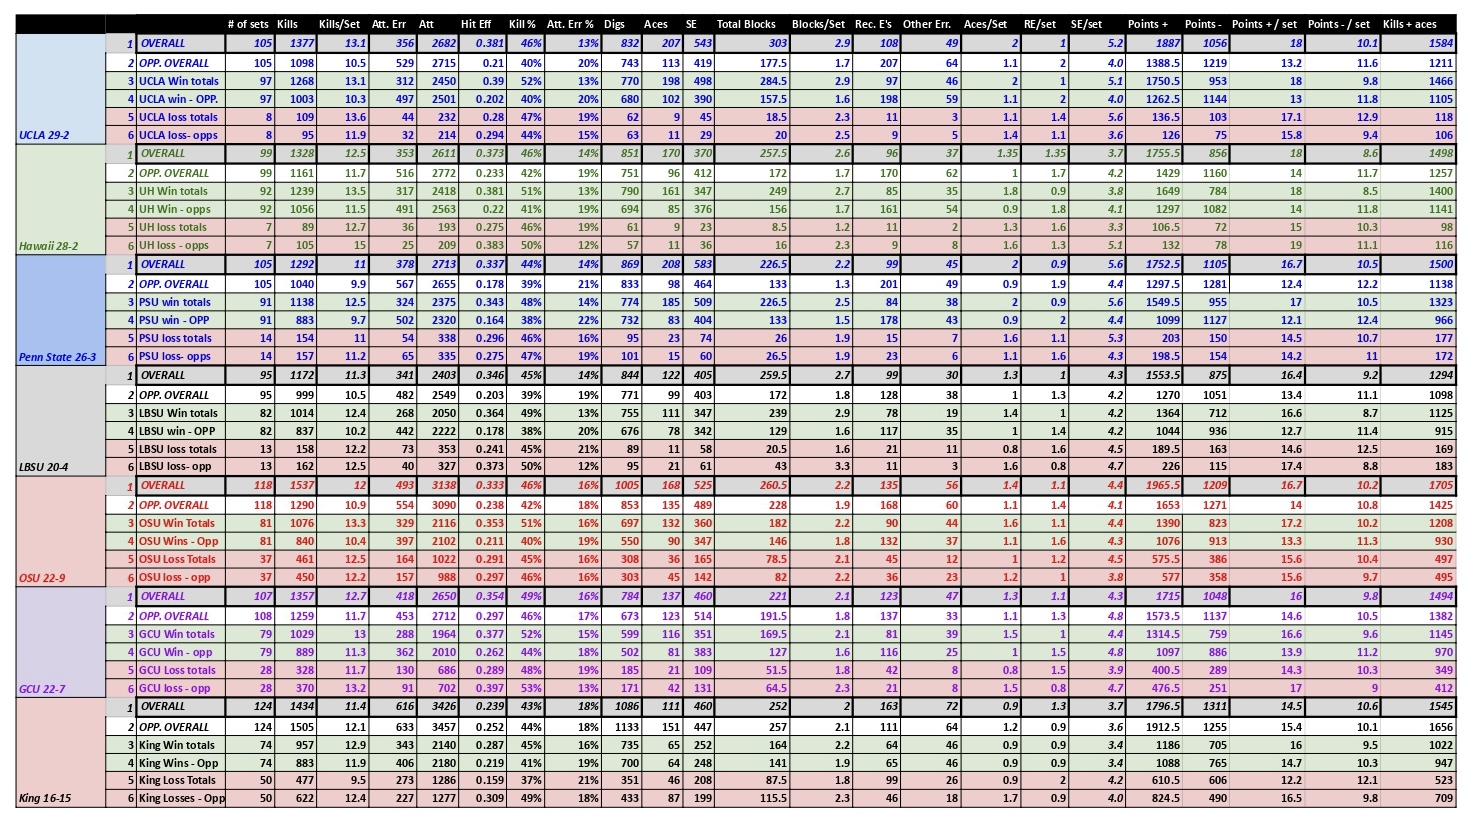
Each team has six rows:
1) Season Overall Stats
2) Opponent’s Overall stats
3) Stats during wins
4) Opponent’s stats during those wins
5) Stats during losses
6) Opponent’s stats during those losses
Notes:
– The number of games is just total number of games played – not games won or lost. For example, for UCLA, in their wins, they played 97 total games, and in their two losses, they played eight total sets.
– “Other Errors” is Ball Handling Error (BHE) or Blocking Error (BE) on the box score.
– Long Beach State’s statlines include their two matches vs. McMaster, so their total will look slightly different from what’s listed on their website.
– The Kills + aces column is just exactly what it is – kills + aces.
Takeaways:
– In both UCLA’s and Hawai’i’s wins, they are scoring 18 points per game, with UCLA limiting their opponents to 13 and 14 point per game respectively.
– UCLA is giving up 9.8 points per game in wins, and Hawai’i is giving up a mere 8.5 points per game. Long Beach State is right there with giving up 8.7 points per game.
– King has the most dramatic difference in hitting percentage in their losses – hitting just .159 in losses, and opponents hitting .309. I would attribute that difference to the tough matches King scheduled.
– In UCLA’s and Penn State’s wins, they’re at a whopping two aces per game.
– Everyone’s favorite statline: UCLA’s and Penn State’s wins combine for over 1,000 SE’s. UCLA is at 5.1 SE/set and PSU is at 5.6 SE/set.
[Editor’s Note: Virginia Pham is the USC Men’s Volleyball Director of Operations and Technical Coordinator. Her views do not necessarily reflect the views of Off the Block ]